David Rumsey Map Collections at Stanford University
 Students are introduced to the practice of "Ekphrasis" to practice "reading" an image/photograph.
David Rumsey Map Collections at Stanford University
🪛 David Rumsey Map Center Collections
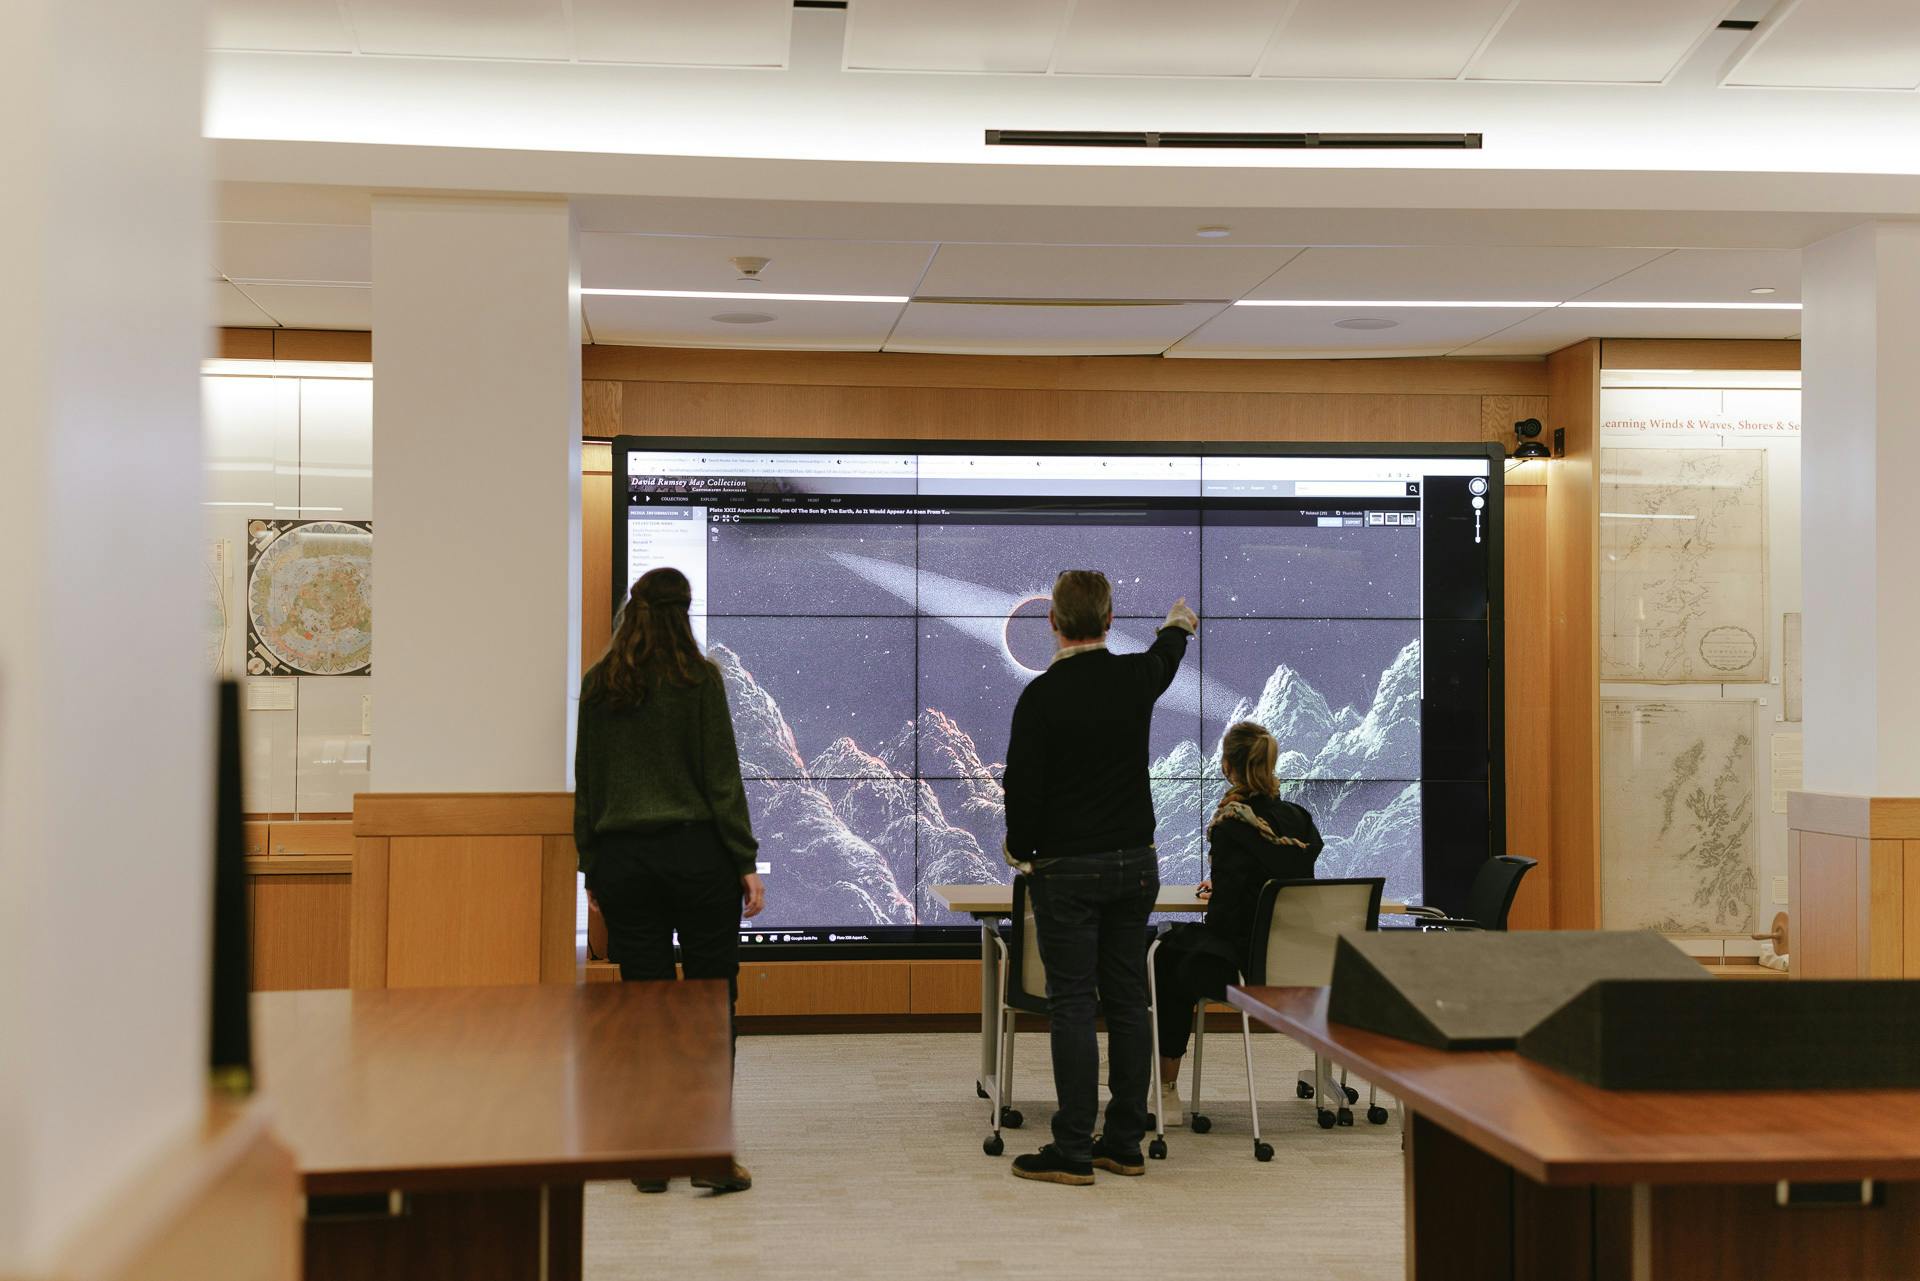 The David Rumsey Map Center at Stanford University is a unique facility which pairs an extensive collection of maps, globes, and atlases with a suite of technology tools for discovering, viewing, and transforming high-resolution images of historical cartographic objects. The collection numbers in the hundreds of thousands of digital and physical objects, with new acquisitions added on a weekly basis. The center is also an exhibition space with a dynamic lineup of shows that feature cartographic materials. Two wall-sized screens are available for viewing maps and metadata in detail. The Center periodically host conferences, talks, and events, and the map librarians provide consultations and support for researchers, classes, and the public.</p>
💡 Concept
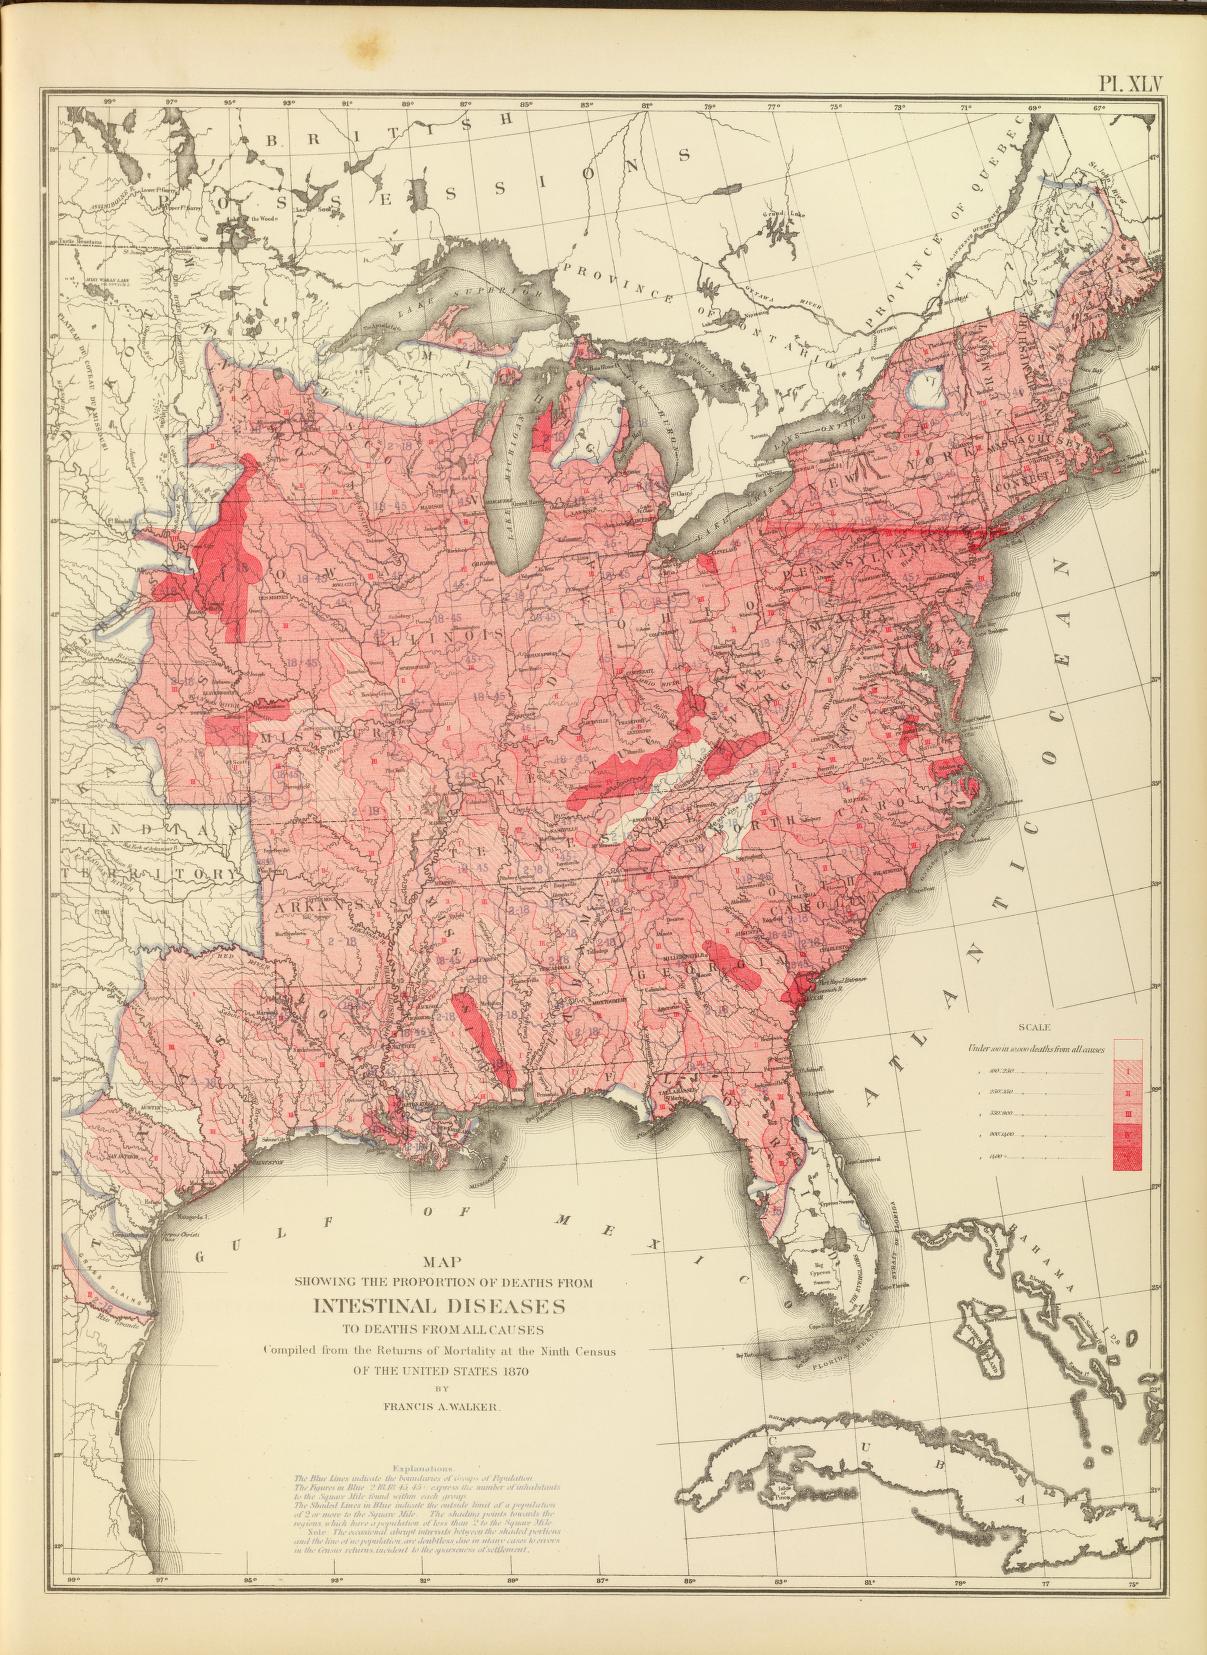 Maps are rich sources of information about the past. Historical maps are unfamiliar to many people, but with a bit of practice anyone can learn to read them. A great way to start is by simply looking closely at a map and making observations. Maps are rich visual representations of places, people, and things in spatial relationships. They typically combine images and text, and can depict real or fictional locations and events. All maps leave out some information in order to make the things that they do contain more legible, or easier to see and understand. The symbols used to convey a map's meaning can be examined for clues about the maker's perceptions, priorities, beliefs, and biases. Some maps clearly convey messages about how they were intended to be used, but some maps from the past can be difficult for us to interpret on their own.
Historical maps of disease, spanning from early modern "medical topographies" to modern digital cartographies, reveal how changing theories of health and disease have shaped our understanding of human populations and their environments. Over time, medical mapping has evolved from a simple analytical tool for tracking epidemics like plague and yellow fever into a powerful instrument of empire, national sovereignty, and public health propaganda. The maps in this collection demonstrate the powerful role cartography has played in constructing ideas about "pathological spaces," legitimating medical interventions, and visualizing the complex ecological and social factors—from climate and soil to poverty and race—that determine the distribution of sickness and health.
🖥️ Activity
In this activity you will browse a curated selection of digitized maps representing aspects of medical maps from the David Rumsey Map Collections, choose one for close inspection, and spend some time looking for details and clues about its historical context. Using the cropping tool in the Tools section below, you will capture details of maps that suggest a particular meaning, help you to understand something about the map's purpose, or make you wonder why the author chose to include them on the map.
The virtual tour to the map center, you will be guided to view and examine the original archival objects represented by the digital images collected here. This activity will both familiarize you with the content during the virtual visit and give you an opportunity to practice analyzing cartographic imagery.
👓 Examples
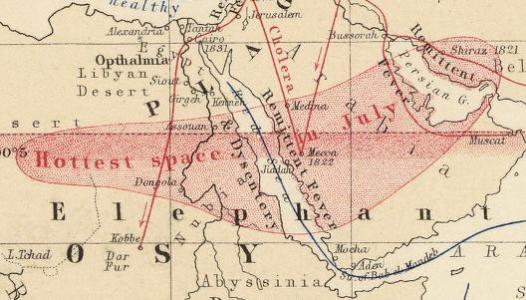
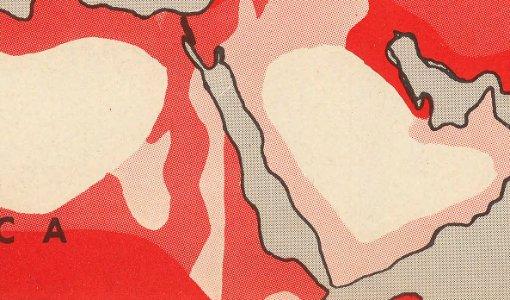
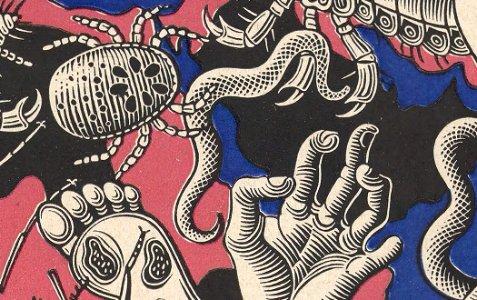
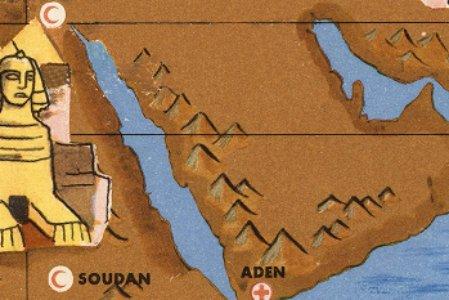
Here are just a few map details cropped from our collection to give you a sense of the variety of information presented on them.
🧱 Materials
🛠️ Tools
IIIF Cropping Tool
Click here to open and use the Cropping Tool to select image details for your discussion post (instructions are in the Steps section below.)
🪜 Steps
Part 1: Browsing
For this first part of the activity you will take a look through all the curated maps in the map gallery
- Click on any thumbnail to open a zoomable version in the pane to the right.
- Resize the zoom window by dragging the grey divider line to the left or right.
- Hide and show the viewing pane and/or input panel using the corresponding links in the header.
- Click the View Item link in a map card to see the item in the original catalog record.
Part 2: Examining
Once you've viewed them all, you will choose one map to look at more closely
- Start by identifying some essential information about your map:
- Is there a key or legend? If yes, it may contain other essential information.
- Information about its creation. (Don't just copy this from the map card! If you can find it, say where it is on the map.)
- Author / Publisher
- Title
- Date published
- Language
- Format (e.g. book, flat map, folded map, pamphlet, globe, etc.)
- See if you can tell what purposes this map was made for: what indicators or clues can you find in the map about its intended use?
- Take a look at the print, lettering, symbols, colors, and illustrations: what do you notice? Is there anything that stands out to you, or is unexpected?
- What is the historical context of publication/creation? Think about what you know about the time and the place where it was made. What indicators or clues can you find in the map about this context?
- What is the argument or point-of-view of the map? What does it show and what does it omit?
- After examining it closely, do you have questions about the map? What are you wondering about it?
- Go back to the collection of maps. Are there any that seem related to yours in some way? What connections do you see?
Cropping a IIIF image
To select a portion of an image
- Click thumbnail to load in the IIIF Cropping Tool viewer
- Zoom and view
- To crop a detail from the image, click the white pencil icon, and highlight the desired rectangle by clicking and dragging a rectangle from corner to corner
- A thumbnail of your selected detail will appear in a slider at the bottom of the Cropping Tool. Click on "Actual" under the second grey box on the left.You can repeat to collect multiple details.
- Go to the thumb Click the Copy icon
 on the left side of the thumbnail
Posting with an image
To add image details to a discussion post
- Click Reply
- To enter your image details, simply paste into the text field
- Images can be manually resized by highlighting and dragging their corners
- Repeat for additional images
✉️ Share
Use this discussion forum to share your observations about maps and your map with peers. Submit a reflective post of approximately 40-60 words describing what you learned about your chosen map from your own close examination, following the questions in Part 2 above.
Tips:
-
- Use only the map, the information visible on the card, and the catalog record, and do not refer to outside sources.
- It's ok if you're not able to answer all of the questions -- just say that you couldn't find the information.
- It is fair play to use digital translation tools to read text in languages you don't understand, just mention this in your response.
- There are no wrong answers! The point of this exercise is for you to practice looking closely and interpreting what you see.
Post by [date]
🤝 Collaborate
Once you have submitted your own post, take a little time to look through submissions by your peers in the discussion forum. Do any resonate with your own observations? Did you learn something interesting or unexpected that you hadn't noticed about your own chosen item? Reply to at least one post by your peer and tell them about it.
Interact by [date]